Object history state widget.
The widget illustrates the history of the object’s states, allows you to select a point in time of interest and view the values and states of the indicators, to determine why the object is in that particular state.
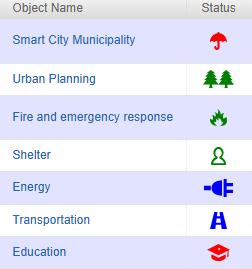
To open the widget, you can click on the object status symbol in the Status column on the Client’s main page ("Status column" Figure):
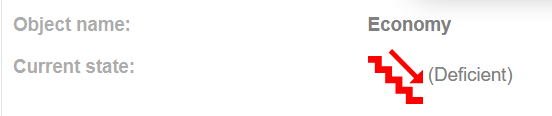
You can also open the widget from the Overview tab of the object report by clicking on the object’s relationship icon ("Status icon in the Report" Figure) правее надписи "Object state":
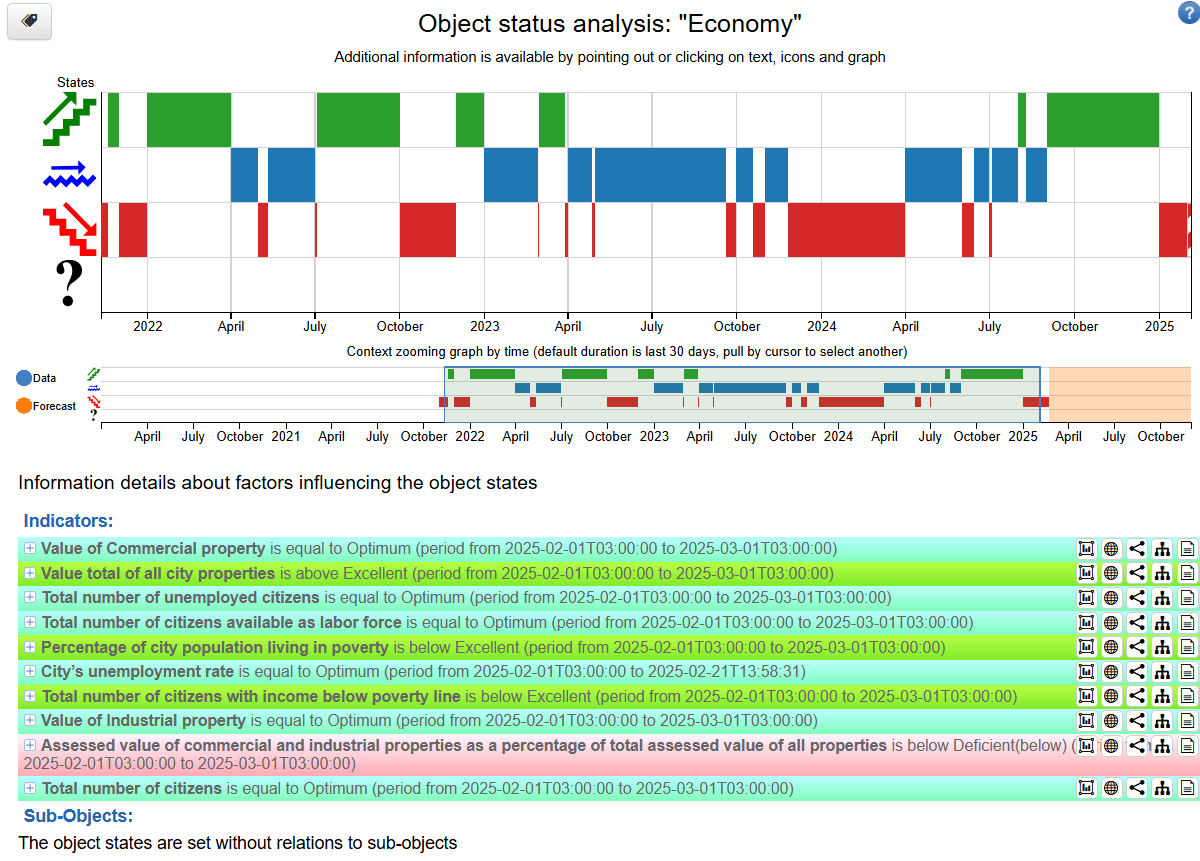
An example of a widget is shown on "Object status analysis window" Figure:
At the top of the widget is an icon for sorting objects using tags  When you click this button, it opens a list of tags, selecting them leaves only the objects
containing them. For more information on working with tags, refer to
Tag sorting in Navigator instruction.
When you click this button, it opens a list of tags, selecting them leaves only the objects
containing them. For more information on working with tags, refer to
Tag sorting in Navigator instruction.
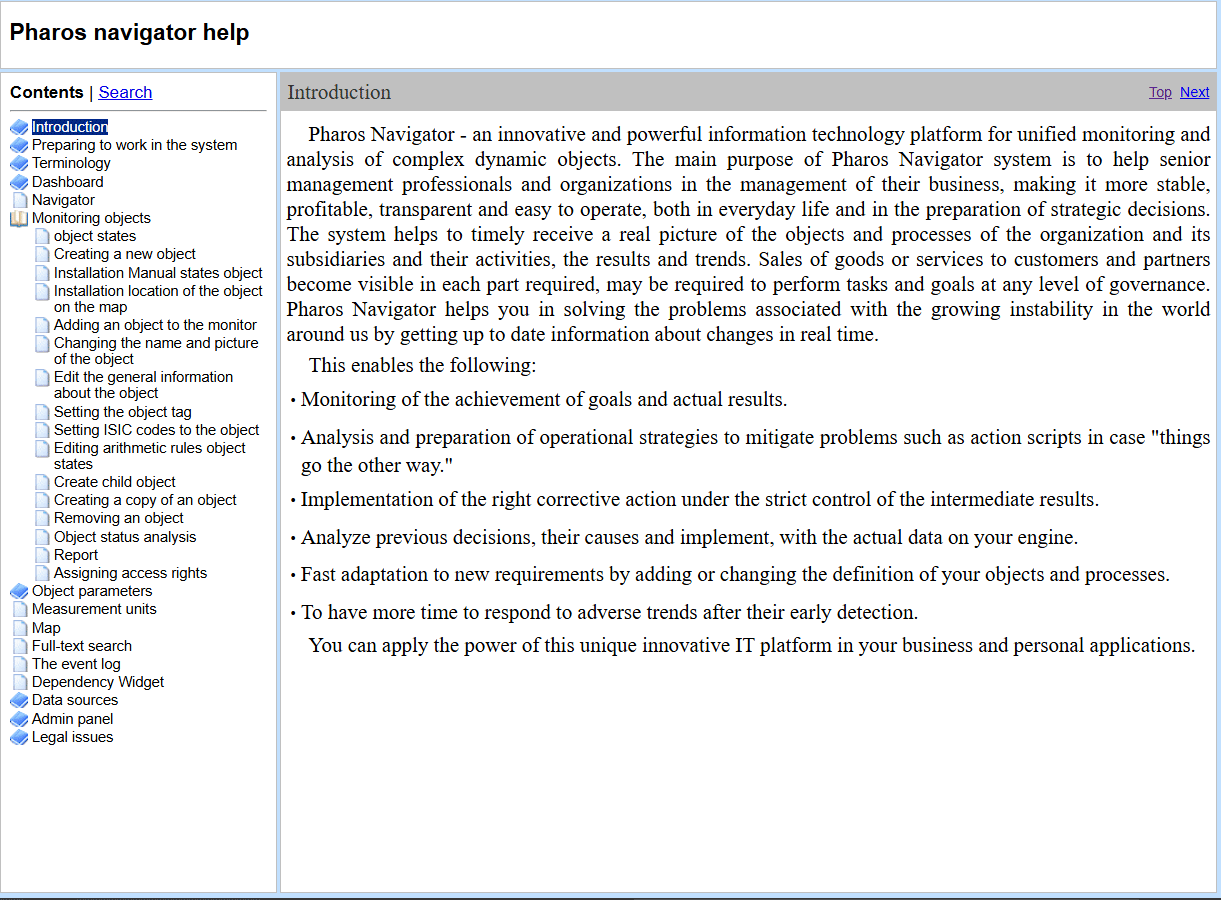
In the upper right part there is a button "Help"  , when you click on it, it will open the
help window ("Help window" Figure):
, when you click on it, it will open the
help window ("Help window" Figure):
Below is a graphical illustration of the object state history ("Graphic widget part" Figure).
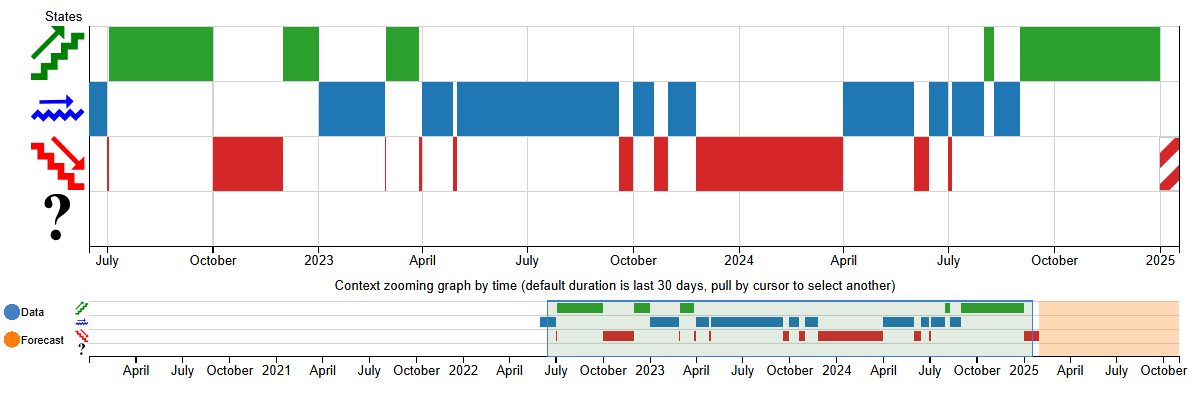
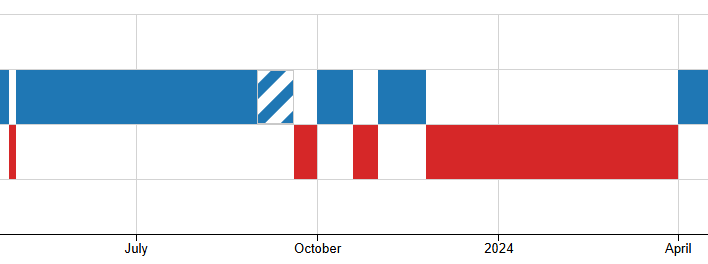
The states of the object are separated by colour. On the left are the names of the states and their symbolic representations. In the graph, states are shown as rectangles. The rectangles are arranged according to the symbols of the states to which they correspond to. The length of the rectangles corresponds to the time interval in which the object was in this state. When you click on a rectangle, it is shaded with the colour it was painted with. An example is shown on "Choosed part" Figure:
The length of the rectangles is different, and depends on the time the model data is updated. The longer the rectangle, the longer the data was updated during this period.
Below is the chart zoom scale. It is shown on the "Context zooming graph by time scale" Figure:
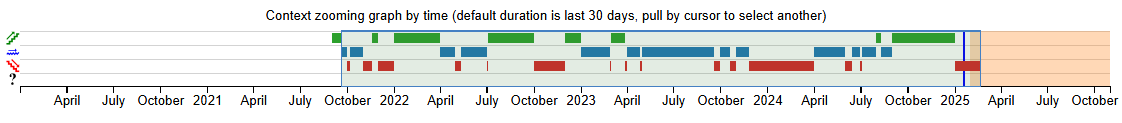
The scale is necessary to set the time interval, which is displayed on the main chart. To set the required time interval for displaying, you should put the mouse pointer on the boundary of the selected interval, press the left mouse button and move the boundary to the left or right. Thus, both boundaries change. Also, under the chart and zoom bar, there are tools for masturbation:
Controlling the scale with Zoom elements
Below the graph and the horizontal scale, there are controls for displaying the graph on the screen, except for the possibility of manual control.
On the left side of the chart is the Zoom scale, which contains the following items: 5m, 15m, 30m, 1h, 2h, 3h,6h, 12h, 1d, 3d, 7d, 1m, 3m, 6m, 1y, All ("Time period scale" Figure)

If you click with the left mouse button on one of the elements, the width of the viewed fragment is set.
If the required width is not available, you can use the range settings, using the calendars which are located on the right side under the main chart ("Calendars period adding" Figure).

Opening a calendar for settings is done by left-clicking on each of the calendars. To add date and time using the calendar, proceed as follows:
Calendar represents a panel for selecting the date and time of the configuration to be loaded. To select the date, click on the date window, the date and time selection window will open ("Config calendar" Figure):
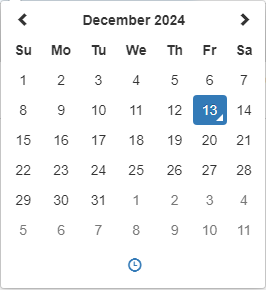
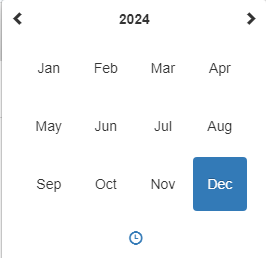
To change the month, you need to click with the left mouse button on its name in the upper part of the calendar. A window with names of months will open ("Mounth window" Figure), and the year will be shown in the upper part.
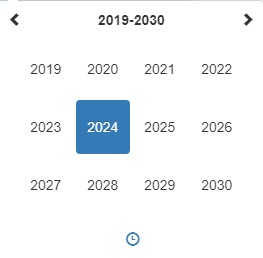
To change the year, click on the year at the top of the window ("Mounth window" Figure). A window for selecting the year will open. The window for selecting the nearest year ("Year window" Figure) will open:
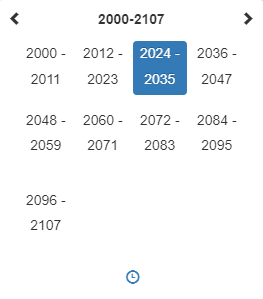
To further change the year, you can click on the year period in the upper part of the window ("Year window" Figure), This will open a window with different periods to select the desired year. The window is shown in the "Year period window" Figure:
To change the time, you need to click on the icon  , a window for entering the
required time will open ("Time changing table" Figure).
, a window for entering the
required time will open ("Time changing table" Figure).
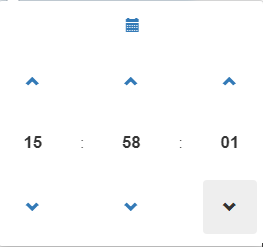
The time can be changed using the buttons  or
or  . Also, clicking
on a numeric time value (hours, minutes or seconds) opens a table for quick selection of the number of
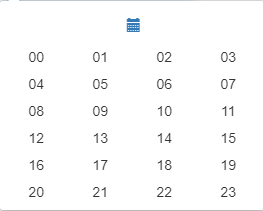
hours ("Hours table" Figure):
. Also, clicking
on a numeric time value (hours, minutes or seconds) opens a table for quick selection of the number of
hours ("Hours table" Figure):
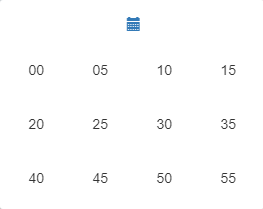
Minutes or seconds ("Minutes/secounds table" Figure):
To return to the calendar mode, you need to click on the button 
The date and time are set automatically when items are selected.
Below, below the horizontal scale, is a scale for moving the above selected interval to the left or right on the timeline. The scale is shown on the "Mooving scale" Figure:

The scale consists of two parts, for moving to the left and for moving to the right. Each part contains in movement step: 5m, 1h, 12h, 1d, 7d, 1m, 6m, 1y. When you click on the selected value, the one selected above the time interval for the demonstration moves to the left or right.
Thus, using these tools, you can view and analyse indicator charts in a user-friendly way.