Sensor Report.
Sensor information
The Sensors report is opened by pressing the button  next to the
name of the sensor. The window will open, it show in the "Sensors Report" Figure:
next to the
name of the sensor. The window will open, it show in the "Sensors Report" Figure:
In the panel, in the same row as the (or  ) button, is a
row of buttons:
) button, is a
row of buttons:
-
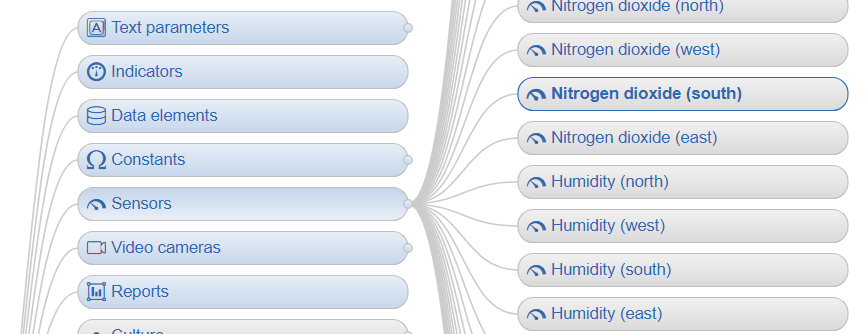
Show in Nnavigator
 - pressing the button opens the Navigator, where
the current sensor is highlighted in bold ("Sensor Show in Nnavigator" Figure):
- pressing the button opens the Navigator, where
the current sensor is highlighted in bold ("Sensor Show in Nnavigator" Figure):
-
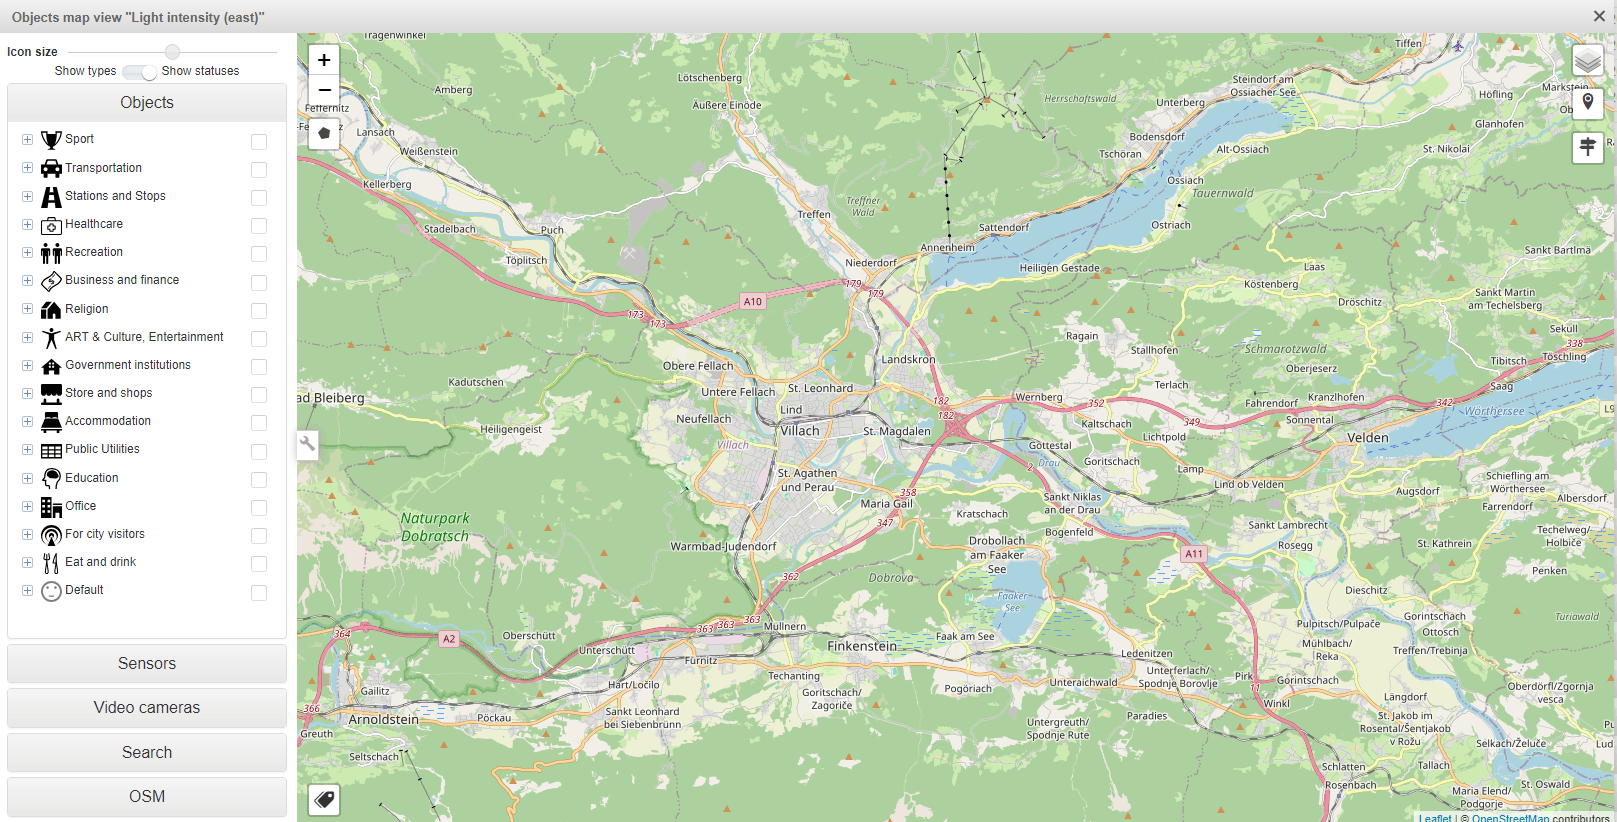
Map
 - When you click on the button, the map window will open with the
sensor marked on the map. If the sensor on the map has not been marked, nothing will happen.
- When you click on the button, the map window will open with the
sensor marked on the map. If the sensor on the map has not been marked, nothing will happen.
Window shown in the "Sensor Map" Figure
-
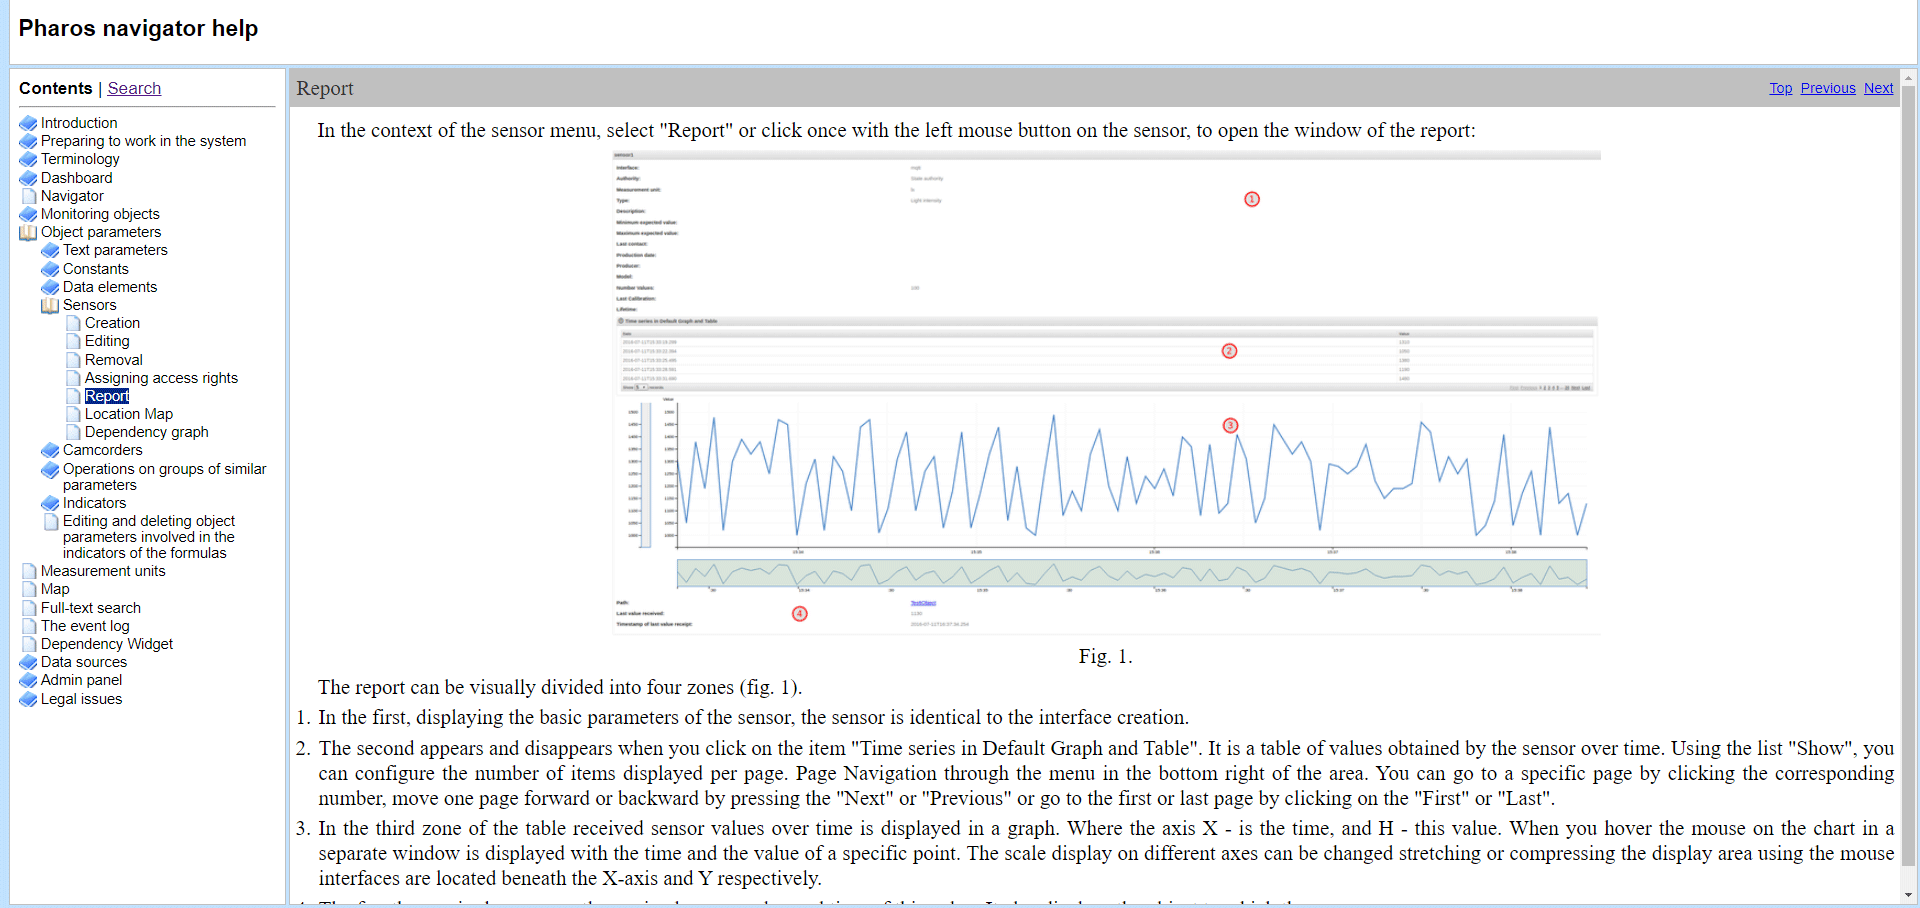
Help
 - When you click on the button, a help window will open with information
about the sensor report ("Sensor Help" Figure):
- When you click on the button, a help window will open with information
about the sensor report ("Sensor Help" Figure):
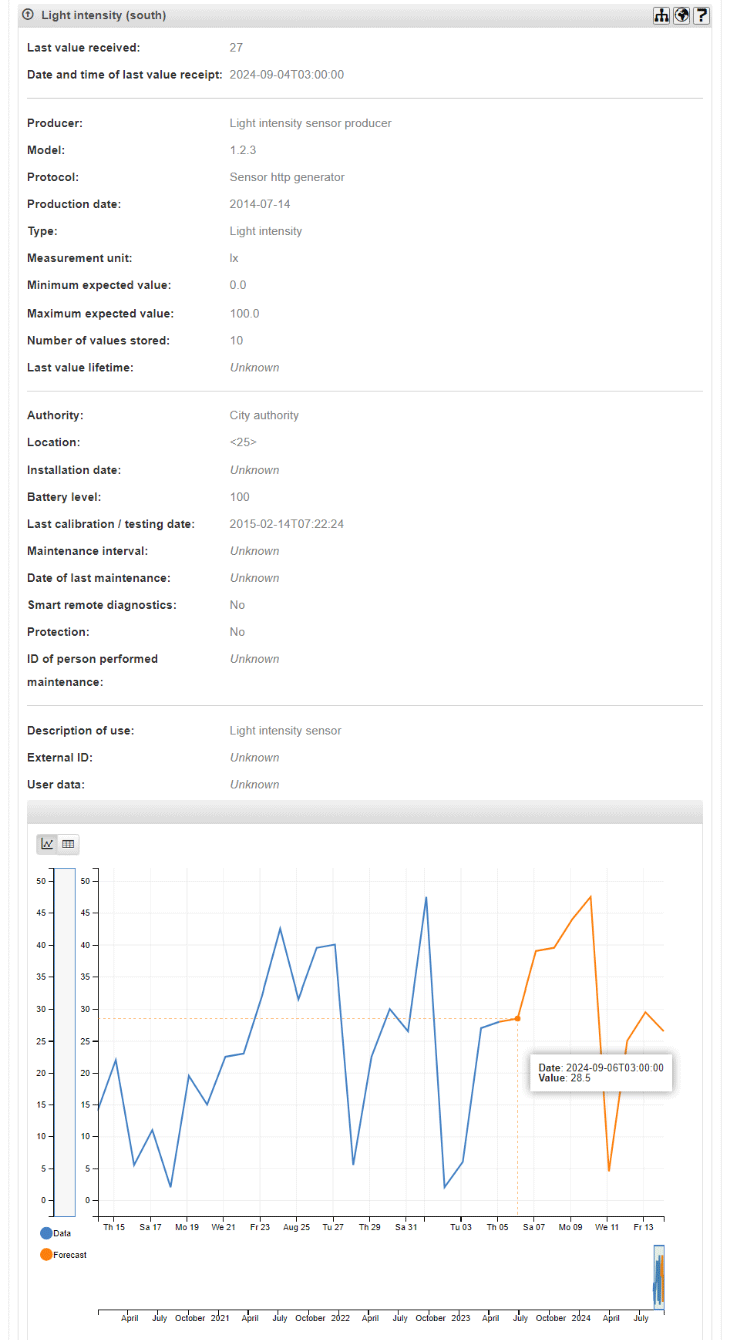
At the top of the report is information about the sensor:
-
Last value received - the last value received from the sensor.
-
Date and time of last value receipt - date and time of the last received value.
-
Producer - Sensor manufacturer
-
Model - sensor model
-
Protocol - sensor data transfer protocol
-
Production date - the date of manufacture of the sensor
-
Type - drop-down list with the supported sensor types (required). To date, the list includes the following types:
-
Light intensity;
-
Humidity;
-
Sound levels;
-
CO;
-
Temperature;
-
Nox;
-
Bar code;
-
Proximity card;
-
Area sensor;
-
Weight
-
-
Measurement unit - sensor measurement unit
-
Minimum expected value - minimum possible sensor value
-
Maximum expected value - maximum possible sensor value
-
Number of values stored - number of stored sensor values
-
Last value lifetime - specified time during which the value of the sensor is up to date.
-
Authority - - the list of sensor accessories (required):
-
State authority;
-
City authority;
-
Citizen authority
-
-
Location - sensor location.
-
Installation date - sensor installation date
-
Battery level - sensor battery level
-
Last calibration / testing date - date of the last sensor calibration/test.
-
Maintenance interval - sensor maintenance period
-
Date of last maintenance - date of last sensor maintenance
-
Smart remote diagnostics - is there any possibility of remote diagnostics
-
Protection - whether or not the sensor is protected
-
ID of person performed maintenance - identifier of the person responsible for executing maintenance
-
Description of use - description of how to use the sensor
-
External ID - sensor ID
-
User data - user information about the sensor.
Data presentation, graph settings.
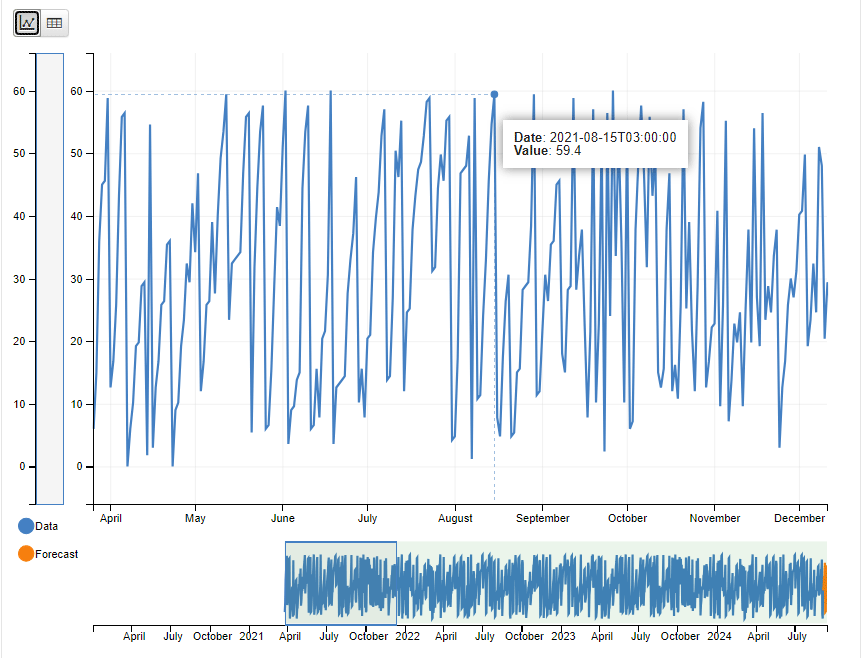
The trend presentation of the data is shown in the "Sensor trend" Figure:

The data obtained from the calculation of the data element can be presented in the following views:
-
In the form of a graph, click on the button
 in the upper left part of the
graph, the data will take the form of a graph
in the upper left part of the
graph, the data will take the form of a graph
-
In the form of a table with data, to do this, click on the button
 in the
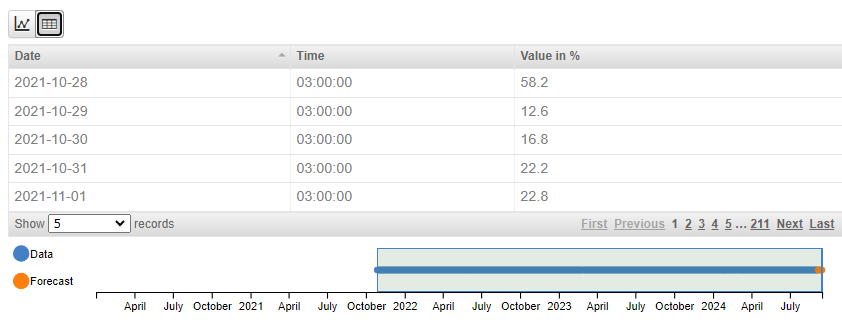
upper left part of the chart, the data will take the form of a table ("Sensor Table" Figure):
in the
upper left part of the chart, the data will take the form of a table ("Sensor Table" Figure):
Changing the appearance of graphs:
To change the appearance of the charts, there are horizontal and vertical scales at the bottom and left of the chart panel, which help to customise the viewing of the charts.
The horizontal scale allows you to select time intervals for viewing the sensor values ("Sensor Horizontal scale" Figure):

The vertical scale allows you to change the scale of sensor values. This may be necessary for more convenient viewing of the chart with minor changes in time ("Sensor Vertical scale" Figure):
Below the graph and the horizontal scale, there are controls for displaying the graph on the screen, except for the possibility of manual control.
On the left side of the chart is the Zoom scale, which contains the following items: 5m, 15m, 30m, 1h, 2h, 3h,6h, 12h, 1d, 3d, 7d, 1m, 3m, 6m, 1y, All ("Time period scale" Figure)

If you click with the left mouse button on one of the elements, the width of the viewed fragment is set.
If the required width is not available, you can use the range settings, using the calendars which are located on the right side under the main chart ("Calendars period adding" Figure).

Opening a calendar for settings is done by left-clicking on each of the calendars. To add date and time using the calendar, proceed as follows:
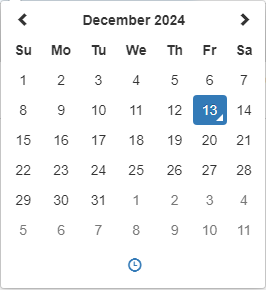
Calendar represents a panel for selecting the date and time of the configuration to be loaded. To select the date, click on the date window, the date and time selection window will open ("Config calendar" Figure):
To change the month, you need to click with the left mouse button on its name in the upper part of the calendar. A window with names of months will open ("Mounth window" Figure), and the year will be shown in the upper part.
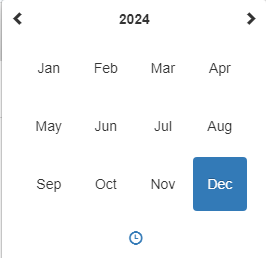
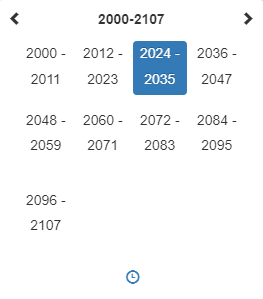
To change the year, click on the year at the top of the window ("Mounth window" Figure). A window for selecting the year will open. The window for selecting the nearest year ("Year window" Figure) will open:
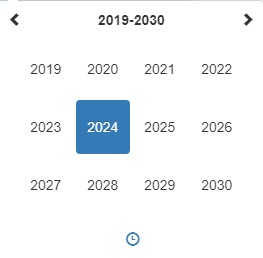
To further change the year, you can click on the year period in the upper part of the window ("Year window" Figure), This will open a window with different periods to select the desired year. The window is shown in the "Year period window" Figure:
To change the time, you need to click on the icon  , a window for entering the
required time will open ("Time changing table" Figure).
, a window for entering the
required time will open ("Time changing table" Figure).
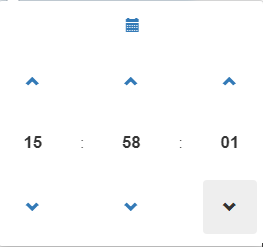
The time can be changed using the buttons  or
or  . Also, clicking
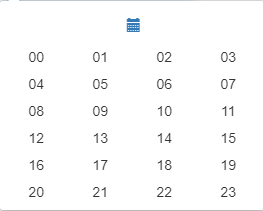
on a numeric time value (hours, minutes or seconds) opens a table for quick selection of the number of
hours ("Hours table" Figure):
. Also, clicking
on a numeric time value (hours, minutes or seconds) opens a table for quick selection of the number of
hours ("Hours table" Figure):
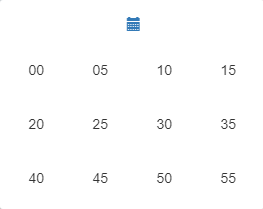
Minutes or seconds ("Minutes/secounds table" Figure):
To return to the calendar mode, you need to click on the button 
The date and time are set automatically when items are selected.
Below, below the horizontal scale, is a scale for moving the above selected interval to the left or right on the timeline. The scale is shown on the "Mooving scale" Figure:

The scale consists of two parts, for moving to the left and for moving to the right. Each part contains in movement step: 5m, 1h, 12h, 1d, 7d, 1m, 6m, 1y. When you click on the selected value, the one selected above the time interval for the demonstration moves to the left or right.
Thus, using these tools, you can view and analyse indicator charts in a user-friendly way.

To change the view of the horizontal or vertical scale, you need to "grab" the left or right edge of the scale with the mouse and move it to the desired position in the horizontal or vertical plane.
To view the value and state of the sensor in the past, you need to move the mouse cursor over the sensor value (a bar of the diagram or a point on the chart), a short note on the selected value will appear, which contains the following information ("Sensor value menu" Figure):
-
Date - date and time of value added
-
Value - sensor value in the period specified above.
Customise the appearance of the data table.
The data table is shown in the "Sensor Table" Figure:
To change the time interval of the displayed values, the horizontal scale under the table is used, similar to the horizontal scale from the previous point. To change the time, you need to "grab" the left or right edge of the scale with the mouse and move it to the desired position in the horizontal plane.

To increase the number of values for viewing in the table ("Sensor Number of values" Figure), select the required number of data from the drop-down list, which is located in the lower part of the table "Show XXXX records".
To select a page for viewing, use the set of buttons in the lower right part of the table. For convenience, there are buttons in it, besides the buttons - page numbers:
-
"First" - to get to the front page
-
"Previous" - to go to the previous page.
-
"Next" - to go to the next page.
-
"Last" - to go to the last page.
The buttons "Previous" and "Next" are convenient to use if there are more pages with data than the set of buttons in the lower right part of the table can accommodate.